By Molly Malone, former staff member
The Center for Rural Affairs applauds the Midcontinent Independent System Operator (MISO) board for unanimously approving the Tranche 1 transmission expansion plan at its July 25 board meeting. This approval is a critical step in relieving grid congestion and enabling renewable energy expansion in southwest Minnesota’s wind belt.
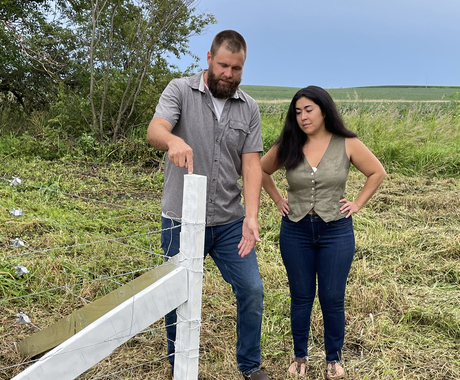
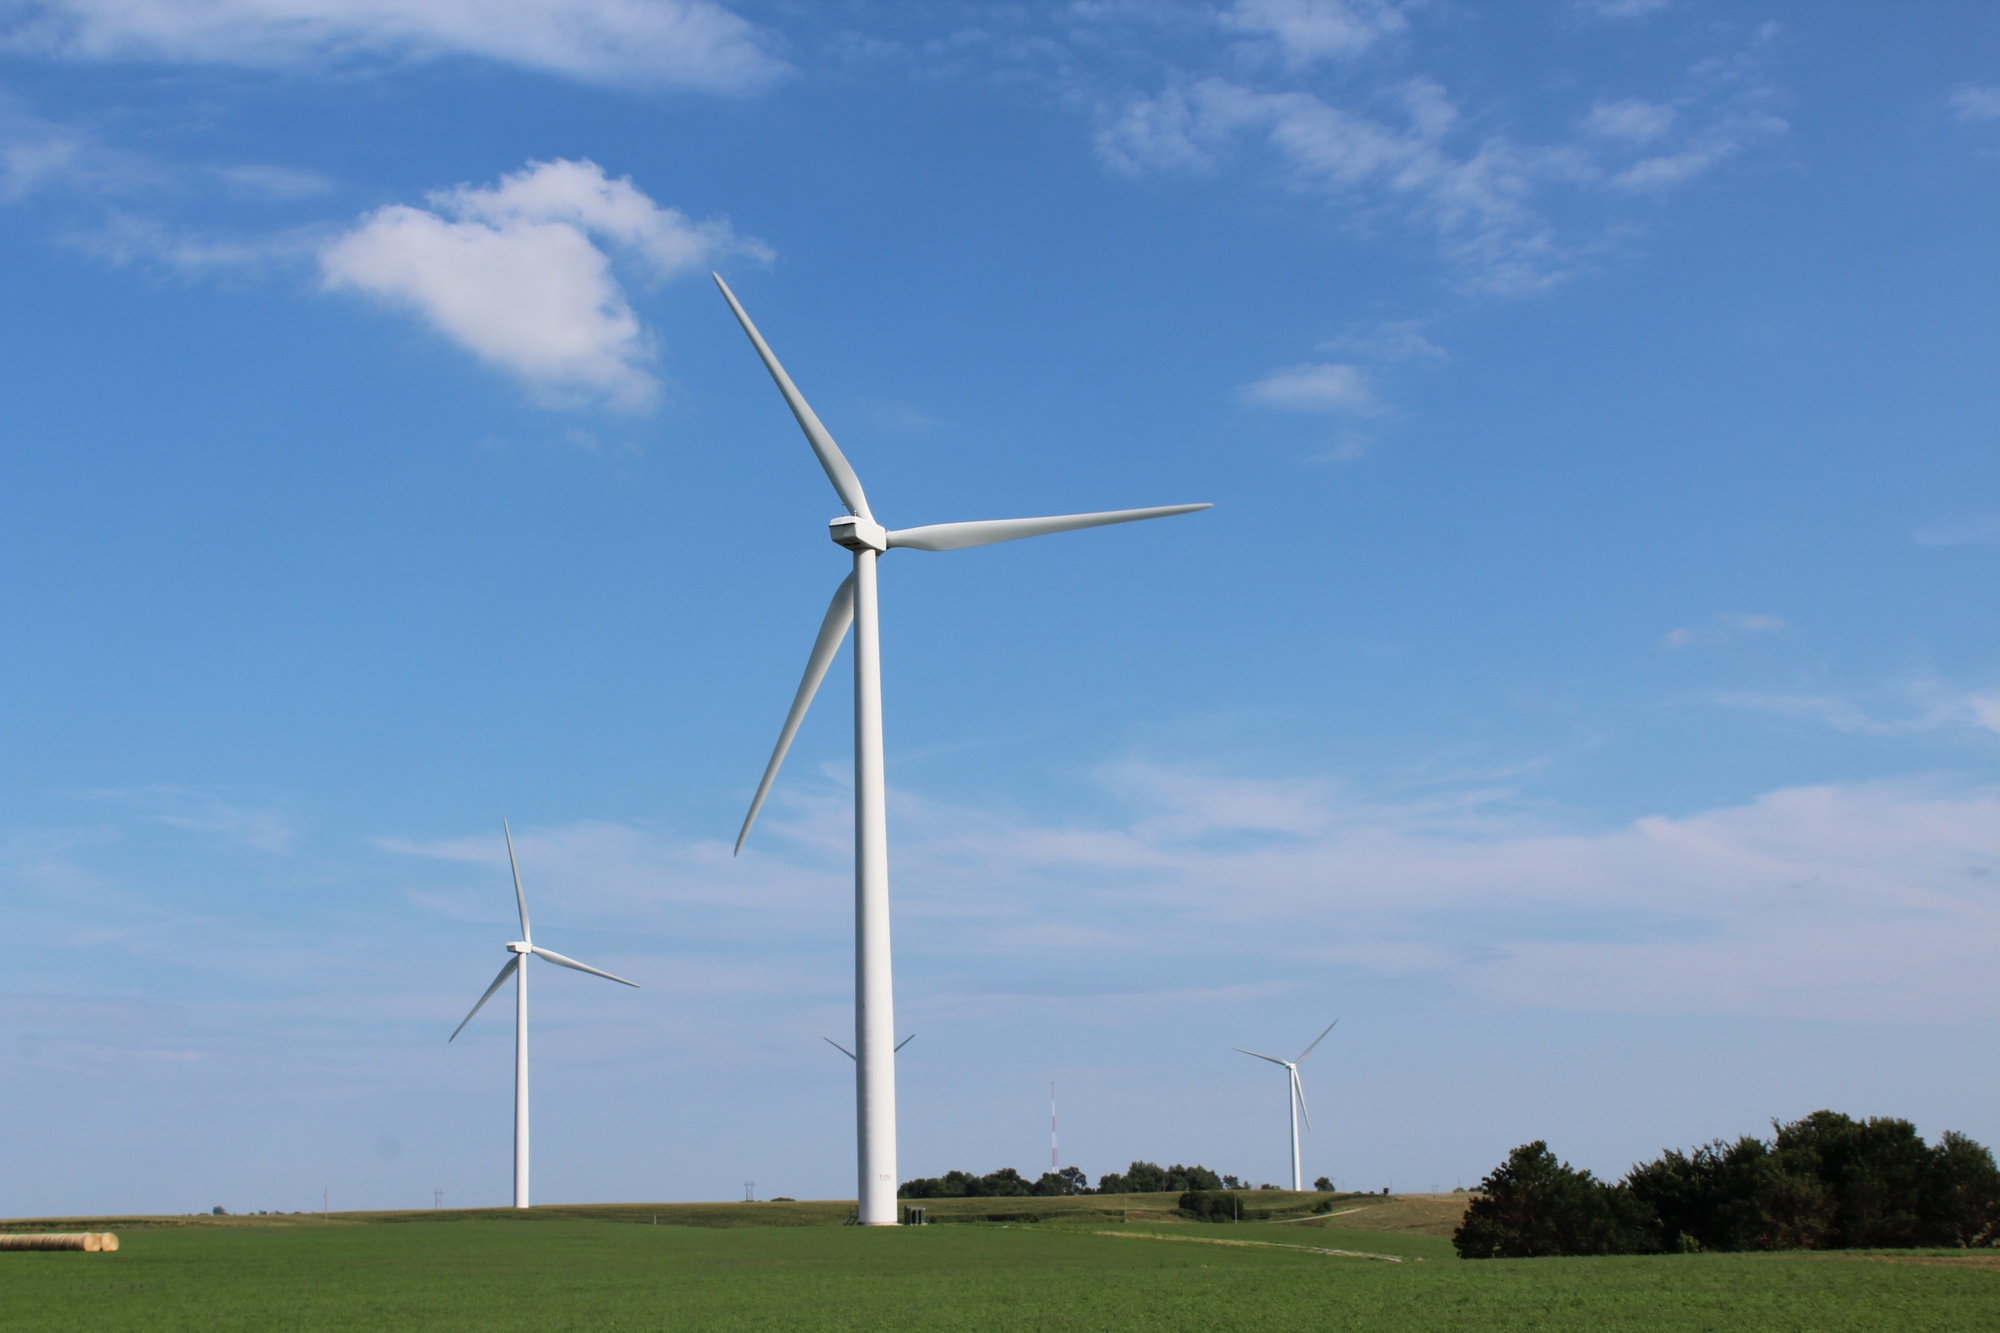
Buffalo Ridge, located in the far southwest corner of Minnesota, has had wind turbines since the 1990s. The geography of the area creates an environment favorable to reliable wind energy production. Recent grid congestion has not only delayed new developments in the region, but also shut down existing wind turbines that are still in working condition.
This is a problem because wind farms provide substantial tax revenue to the communities that host them. In many cases, they are the largest source of property taxes in the county or township. In 2021, some townships in the Buffalo Ridge area saw more than 50% reduction in their wind energy production tax revenue. Additionally, more than $1 million in wind tax revenue was lost between three rural counties and another $700,000 was lost between 15 more. Estimates from developers indicate 2022 production is expected to be curtailed by about 50%.
Changes in wind energy production tax revenue in southwest Minnesota
| Community | 2020 | 2021 | 2022 |
Change |
Change in $ |
|---|---|---|---|---|---|
| Murray County (pop. 8,247) |
$1,149,781 |
$1,273,941 |
$834,414 |
-34% |
-$439,527 |
| Murray County, Fenton Township (pop. 171) |
$276,415 |
$326,835 |
$151,942 |
-54% |
-$174,893 |
| Nobles County, Dewald Township (pop. 258) |
$225,079 |
$243,668 |
$120,535 |
-51% |
-$123,133 |
| Nobles County, Olney Township (pop. 209) |
$75,026 |
$81,223 |
$40,178 |
-51% |
-$41,045 |
| Nobles County, Summit Lake Township (pop. 327) |
$360,284 |
$352,135 |
$184,824 |
-48% |
-$167,311 |
| Nobles County, Wilmont Township (pop. 286) |
$98,720 |
$116,728 |
$54,265 |
-54% |
-$62,462 |
| Jackson County, Enterprise Township (pop. 182) |
$463,605 |
$414,813 |
$311,784 |
-25% |
-$103,029 |
*Figures are whole numbers. 80% goes to the county, 20% to the township
Transmission capacity deficits will widen in subsequent years. MISO projects insufficient transmission capacity to the tune of 2.6 GW below the 2023 Planning Reserve Margin requirement. If demand projections are correct and the grid doesn’t improve, that deficit will grow up to 10.9 GW by 2027—the equivalent of 3,630 utility scale wind towers. The capacity deficit is restricted primarily to MISO North/Central, which includes Minnesota, Iowa, Wisconsin, Michigan, Manitoba, Indiana, Illinois, North Dakota, and part of South Dakota. Some of the deficit is currently offset by exports from the South region.
Unfortunately, transmission planning is a long process. While a planned $2.2 billion investment in three new Minnesota power lines as part of Tranche 1 will alleviate overall grid congestion, the new capacity isn’t expected to come online until 2028. It also doesn’t quite reach directly into the Buffalo Ridge region.
In the meantime, rural communities home to the industry are losing out on current and potential tax revenue crucial to economic resiliency. The Center encourages MISO, regulators and regional utilities to employ other tactics to immediately alleviate grid pressure like repairing equipment failures and moving forward with complementary grid improvements closer to the wind production.
Only with continued focus on unlocking transmission constraints in key areas will the region be able to capitalize on the immense wind energy production potential of our rural areas.
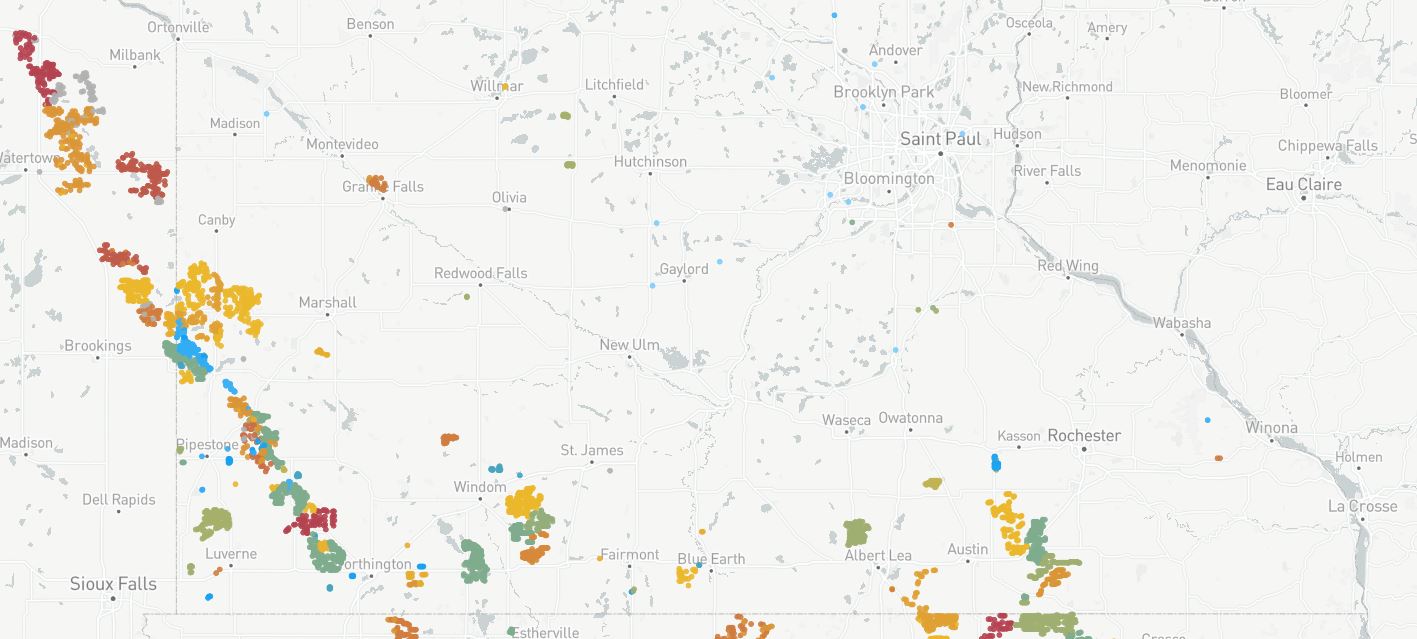
The following maps show the location of wind turbines in southern Minnesota and where the energy production is concentrated.
Southern Minnesota wind turbine locations*
Minnesota, Iowa, South Dakota region
Wind turbine heat map by relative density of turbines
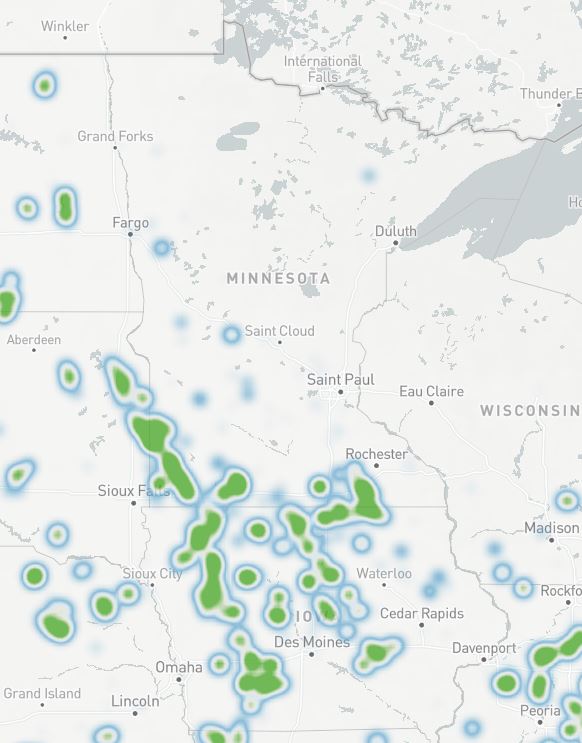
*Hoen, B.D., et al. U.S. Wind Turbine Database v5.0, April 2022: U.S. Geological Survey, American Clean Power Association, and Lawrence Berkeley National Laboratory data release, doi.org/10.5066/F7TX3DN0.